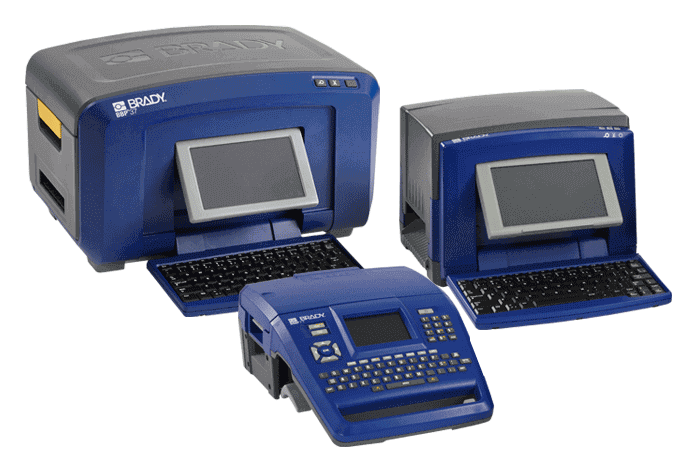
Labels for Safety, Visuals and Facility ID Desktop Printers
Labels for Product, Wire and Lab ID Benchtop Printers
Labels for Safety, Visuals and Facility ID Desktop Printers
Labels for Product, Wire and Lab ID Benchtop Printers
Safety and Facility ID Desktop Printers
Product, Wire and Lab ID Benchtop Printers
Barcode Scanners and RFID Readers
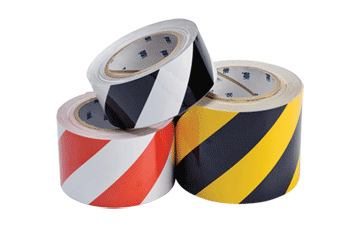
PaintStripe Floor Marking Stencils
Valve Lockouts & Hose Lockouts
Group Lock Boxes & Permit Control
Pipe Marker Accessories & Mounting Brackets
Maintenance and Production Tags
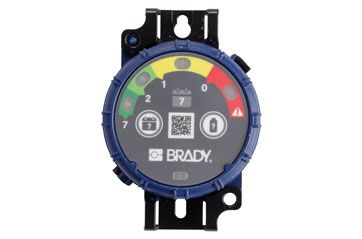
Calculators and Assessment Tools
Product Finders and Data Sheets
Improve equipment performance and reliability
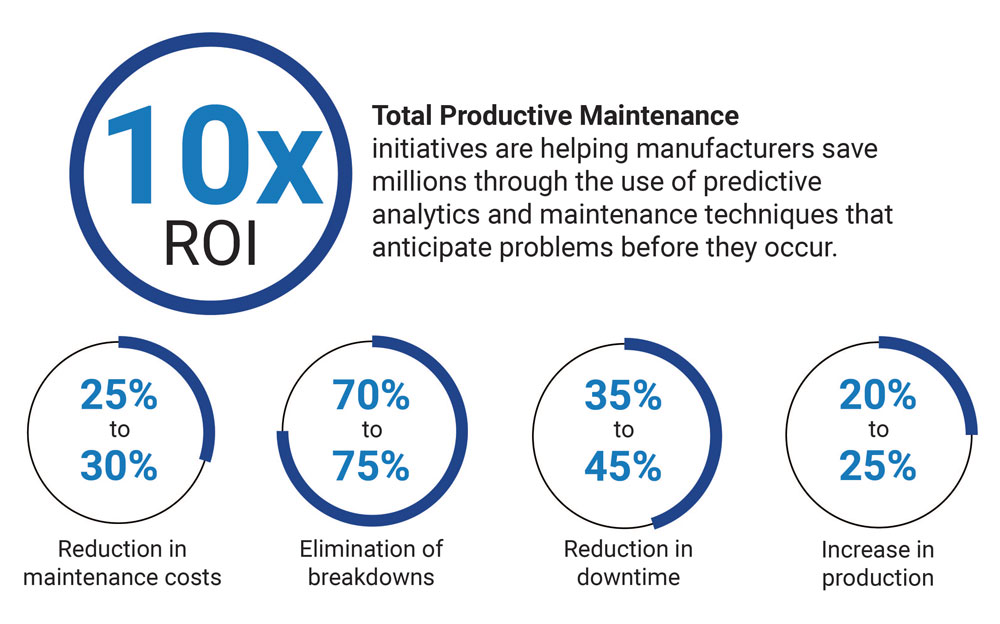
Many companies engage in reactive maintenance, which is when you wait for a problem to show up and then fix it. But this method can be very expensive due to unplanned downtime. Innovators are now saving millions by switching to a Total Productive Maintenance system to ensure machines run optimally, while using predictive analytics and maintenance techniques to anticipate problems before they occur.
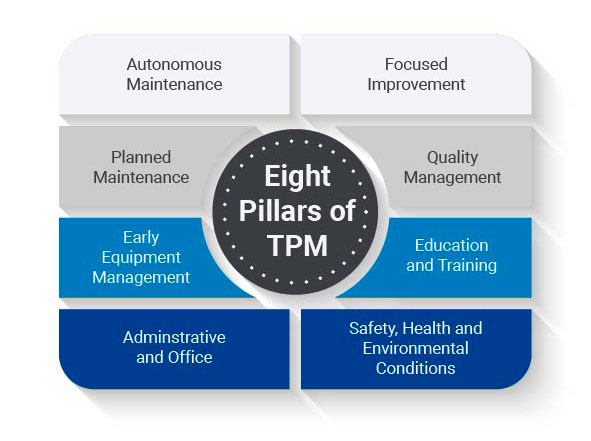
Total Productive Maintenance (TPM) is a system designed to stabilize equipment performance and reliability. The primary goals of TPM are to eliminate waste caused by accidents, emergency and unscheduled downtime, defects and speed losses.
TPM achieves this through proactive maintenance and improvement of the integrity of production, safety and quality systems to ensure all equipment is in top working condition, minimizing breakdowns and delays in manufacturing processes.
TPM is successful because it promotes group activities among shop floor team members. The knowledge base received from team members is used to improve equipment reliability and productivity, thereby lowering maintenance and operating costs.
This is achieved by:
Routine maintenance, such as cleaning, lubrication and inspection, is performed by the machine operator.
Creating a voluntary small group to identify the cause of failure, as well as possible plant and equipment modification.
Data-driven maintenance schedule using prediction and failure rates.
Creating production processes to detect and prevent errors.
Designing new equipment based on knowledge and understanding gained through TPM program.
Train and educate operators, maintenance and managers on necessary information to achieve TPM goals.
Seek ways to apply TPM to administrative and office functions.
Ongoing maintenance of a safe and healthy workplace.
TPM combines three different types of maintenance, including autonomous maintenance, preventive maintenance, and early equipment maintenance. Each plays an essential role in a TPM program:
Determines what maintenance tasks, adjustments or cleaning can be completed by operators due to their daily use of the equipment and knowledge of when a machine acts differently.
Seeks ways to prevent the need for maintenance and introduce methods to monitor the critical areas that require attention in real-time.
Strives to ensure all possible components are no / low maintenance through the design, specification or build of your equipment.
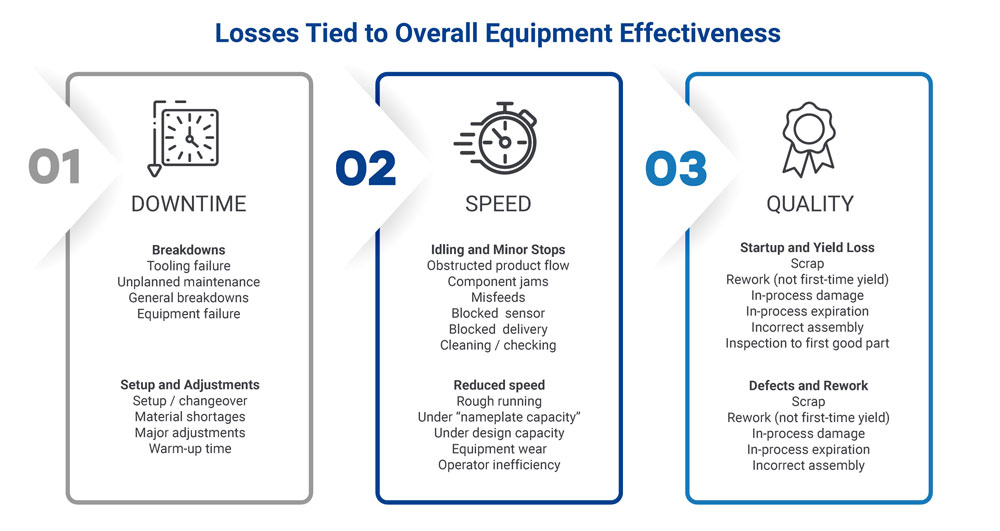
Increasing the Overall Equipment Effectiveness (OEE) is a top priority of a TPM system. Autonomous maintenance uses OEE to measure losses and the opportunity for improvements by defining:
The difference between actual performance and ideal performance is waste, which TPM seeks to eliminate.
The OEE metric can help you develop a clear, cohesive plan of attack for achieving your TPM goals. It includes three factors — availability rate, efficiency rate and quality rate.

Availability rate helps you evaluate how much unplanned downtime you experience because of machine breakdowns or product changeover. When evaluating factory capacity, it’s essential to remove any time allotted for planned maintenance activities that are a part of your preventive maintenance program.
For example, if you have a line that runs 60 hours, and it takes three hours to complete the weekly preventive maintenance, then the equipment is available for 57 hours. When you schedule the weekly production, you must use the 57 hours of availability instead of the 60 hours worked by operators. The preventive maintenance activities remove 5% of the equipment time from the operator. As a plant manager, you can see why it might be tempting to “put-off” the preventive maintenance and just run the equipment to failure.
Efficiency or productivity rate evaluates how much you are idling or stopping the machine, or running at reduced speeds. It’s usually one of the hardest components to identify and correct because identified issues tend to require an all-out blitz to restore the condition to standard.
When your equipment goes down, your maintenance people scramble to get the machine running again. When you have a quality issue, your quality and production people scramble to correct the situation to begin producing good parts. However, when you are running below “nameplate” speed, or you idle the machine, it can just look like a part of the process.
It’s always important to remember that what may be considered standard, may be a hidden issue. When stoppages or reduced speed becomes a normal part of the process, it’s time to use structured problem solving to investigate all of the potential causes for the idling / stoppages and reduced speed.
Quality rate evaluates the level of scrap and rework. In many situations, scrap is considered just a part of how the machine works.
Once again, the quality rate provides the opportunity to use structured problem solving to investigate the potential causes of scrap and rework. When seeking out the causes, it’s important to carefully determine which issues have become accepted as part of running the machine. When there are high levels of rework, there’s a capacity loss across the equipment for “good first-time” parts.
Ideally, to get the complete picture of how a machine runs, you should measure first-pass yield and scrap together.
Direct Benefits of TPM
Indirect Benefits of TPM
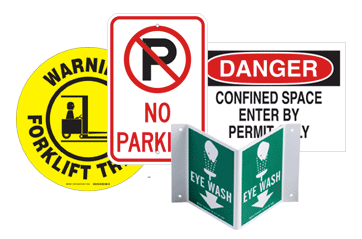
Equipment visuals can help maintain your TPM gains and increase workplace safety. Equipment visuals communicate equipment and task-specific visual cues that help improve the efficiency and effectiveness of human interaction with equipment. These visual cues serve as reminders or warnings by:
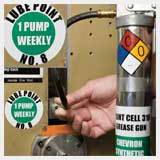
Lubrication errors (both under and over lubrication) are one of the major causes of equipment failures. To maximize OEE, ensure employees are able to easily find the lube point, readily detect proper levels and correctly apply the right amount of lubricant at the appropriate time.
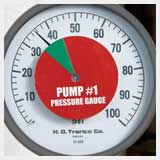
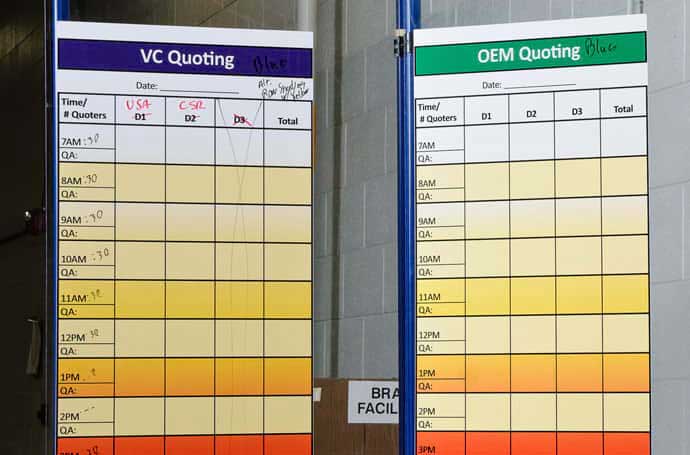
Total productive maintenance visuals make it easy for operators or anyone in the plant to quickly detect operating abnormalities and emerging failures before they happen.
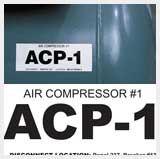
Include "to" and "from" information on equipment ID labels to make it easier to trace lines in electrical and piping systems.
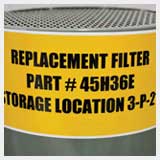
Up to 25% of downtime can be attributed to parts-related issues: going to get parts, looking for the right part, ordering parts, etc. Visuals can greatly simplify these tasks, resulting in faster turnaround, lower inventory costs and improved overall equipment effectiveness.
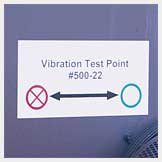
Use visuals to ensure that vibration, ultrasound and infrared measurements are taken at exactly the same spot every time — no matter who takes the reading — to ensure comparable data over time.
Learn more about one of the most widely adopted techniques from the lean manufacturing toolbox.
Learn More
Learn more about one of the visual workplace in a lean manufacturing process.
Learn More
Learn how to use lean visuals more effectively by implementing visual workplace techniques in your facility.
Download Now