Labels for Safety, Visuals and Facility ID Desktop Printers
Labels for Product, Wire and Lab ID Benchtop Printers
Labels for Safety, Visuals and Facility ID Desktop Printers
Labels for Product, Wire and Lab ID Benchtop Printers
Safety and Facility ID Desktop Printers
Product, Wire and Lab ID Benchtop Printers
Barcode Scanners and RFID Readers
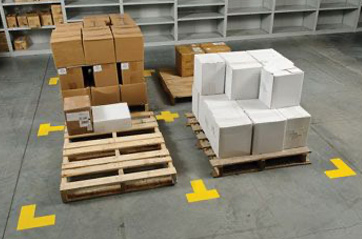
PaintStripe Floor Marking Stencils
Valve Lockouts & Hose Lockouts
Group Lock Boxes & Permit Control
Pipe Marker Accessories & Mounting Brackets
Maintenance and Production Tags
Calculators and Assessment Tools
Product Finders and Data Sheets
Overall Equipment Effectiveness (OEE) is a manufacturing metric that helps determine the degree to which equipment is effectively utilized. Often, it’s a component of an overall lean manufacturing process. OEE is measured by analyzing three critical factors (availability, performance and quality) to help companies gain insight into their equipment's efficiency, identify areas for improvement and optimize their manufacturing process.
The OEE formula is a calculation that provides an overall OEE score. To get it, you multiply three metrics. They are:
Availability

Performance
Quality


Overall Equipment Efficiency
A perfect OEE score of 100 percent represents the ideal state in which equipment is running at maximum efficiency without any defects or downtime. However, a perfect score is not typically attainable. Instead, manufacturers use OEE benchmarks to gauge their equipment's efficiency.
According to the OEE Foundation, the OEE industry standard for manufacturing processes is 85 percent or higher.1 This typically means that the equipment is producing high-quality products with minimal downtime at maximum speed. On the other hand, an OEE score of 60 percent or less1 indicates significant room for improvement in the manufacturing process. An OEE score in this range can help manufacturers identify areas for improvement.
To improve OEE, manufacturers need to identify and minimize the Six Big Losses that can impact their equipment's efficiency and overall score.
|
Six Big Losses
|
Affected OEE metric
|
Examples
|
Visual Solutions
|
|---|---|---|---|
| Equipment failure | Availability |
|
|
| Setup and adjustments | Availability |
|
|
| Idling and minor stops | Speed |
|
|
| Reduced speed | Speed |
|
|
| Process defects | Quality |
|
|
| Reduced yield | Quality |
|
|
Equipment care visuals play a big part in addressing inefficiencies, gaps in maintenance and employee knowledge deficiency. Manufacturers can start to identify and mitigate the Six Big Losses with visual labels and markings.
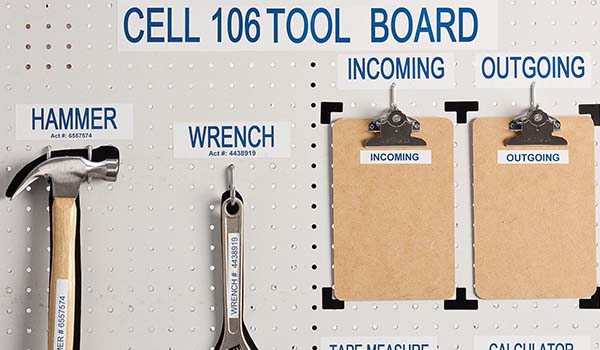
Prevent “tool walk-off” with shadow boards. Color-code by department or area.
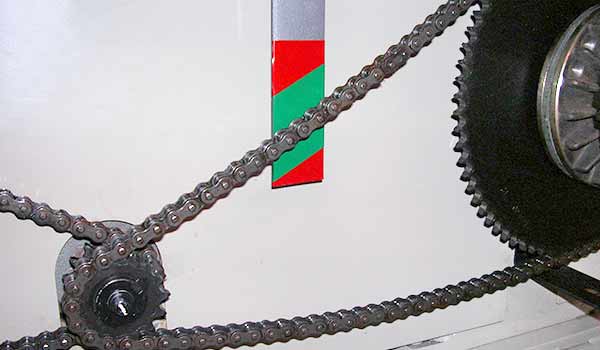
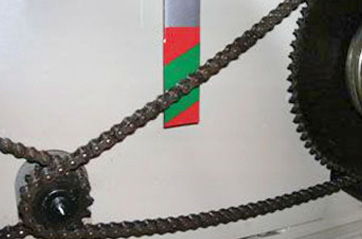
Use color to indicate chain or belt tightening or replacement. Label with action steps.
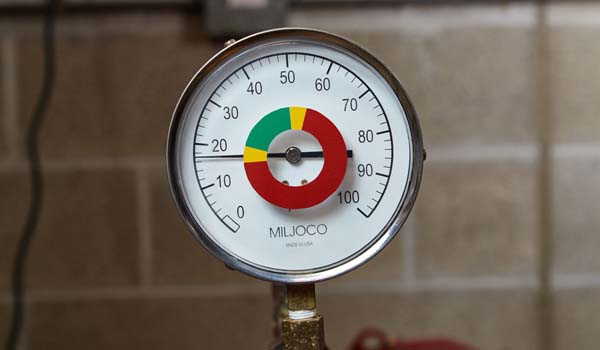
Give any employee the ability to detect abnormal pressures or temperatures.
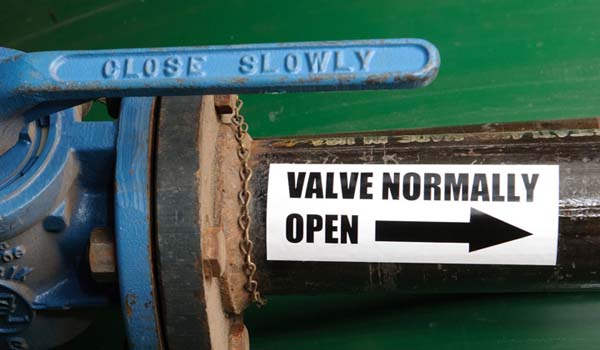
Use when putting equipment into a safe working condition or zero-energy state.
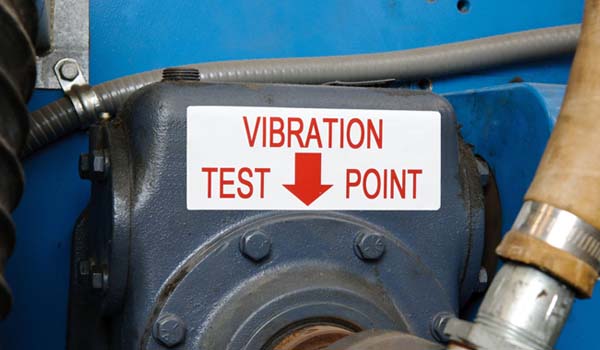
Ensure vibration and ultrasound probes are positioned for maximum repeatability.
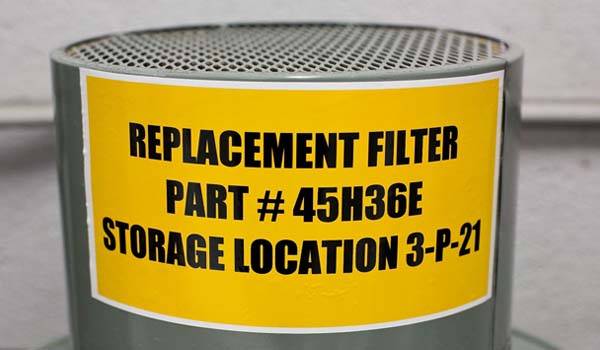
Clearly identify correct replacement parts to eliminate time wasted identifying and ordering.
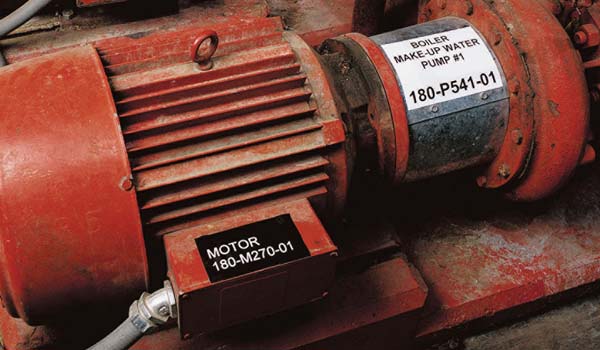
Enable easier asset tracking, problem reporting and repair history visibility.
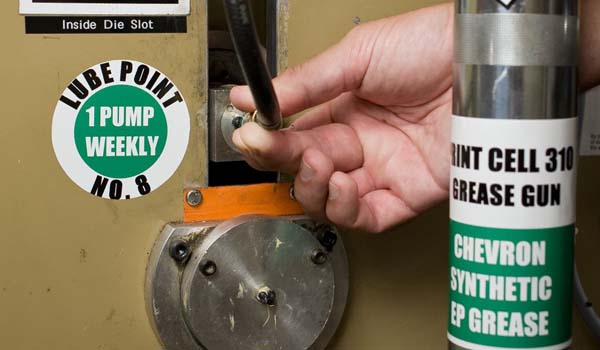
Identify proper grease quantity and frequency, and color code matching lube points and grease guns.
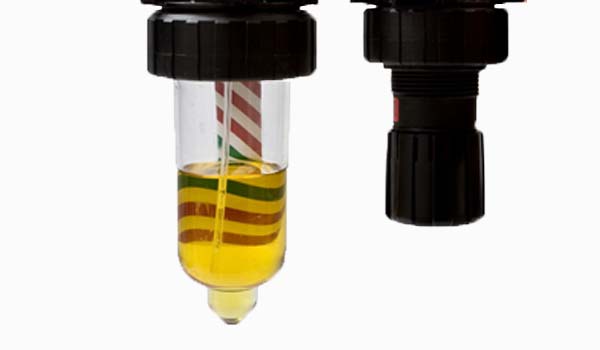
Identify low, normal and high oil levels with green-and-red-striped labels.
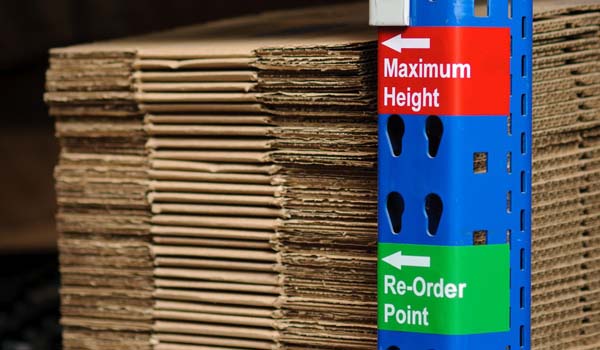
Reinforce stock limits, highlight overstock citations and avoid unnecessarily high inventory.
To get started with OEE, start with these four steps
A leader in visual workplace solutions, Brady offers numerous products and services to help you minimize the Six Big Losses and raise or reinforce your OEE score.
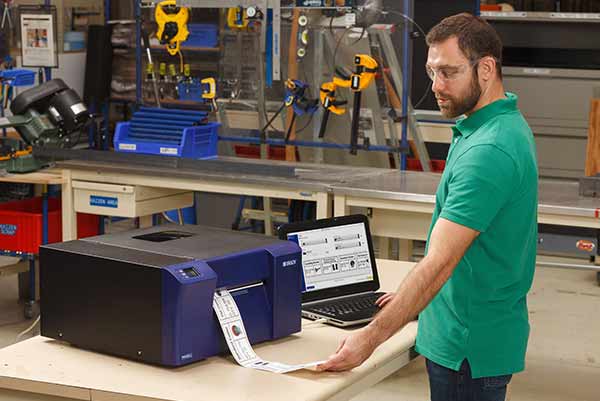
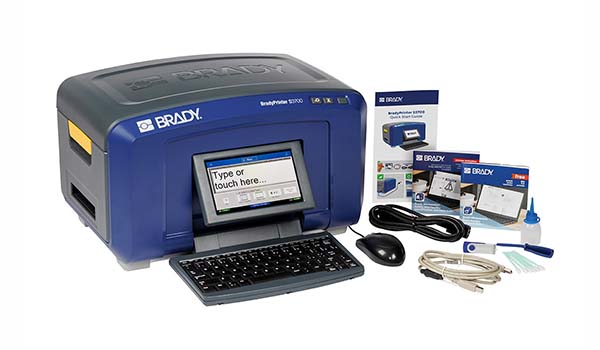
If you’re ready to improve your OEE score, equipment care visuals are a great first step. Bring printing in-house to save on printing and material costs as well as create labels specific to your unique needs and OEE goals. The Brady S3700 Safety Sign and Label Printer with XY Cutter can handle it all. With multicolor printing and a built-in shape cutter, you can create all the custom visuals you need, when you need them.
Shop S3700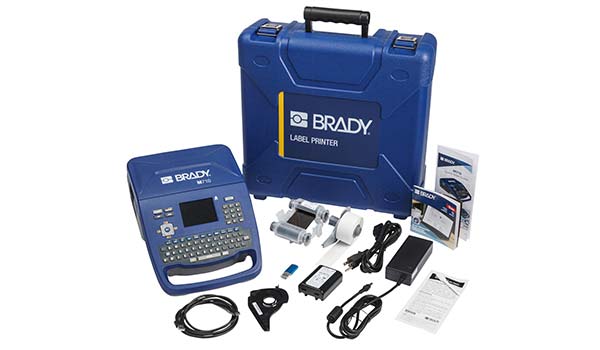
A leader in visual workplace solutions, Brady offers numerous products and services to help you minimize the Six Big Losses and raise or reinforce your OEE score. Select from handheld portable labelers for labeling on the go, tabletop printers for creating big and bold visuals and much more. Reach out to a Brady rep for help selecting the right printer for your needs.
Shop more printersReference